DID YOU KNOW THAT...?
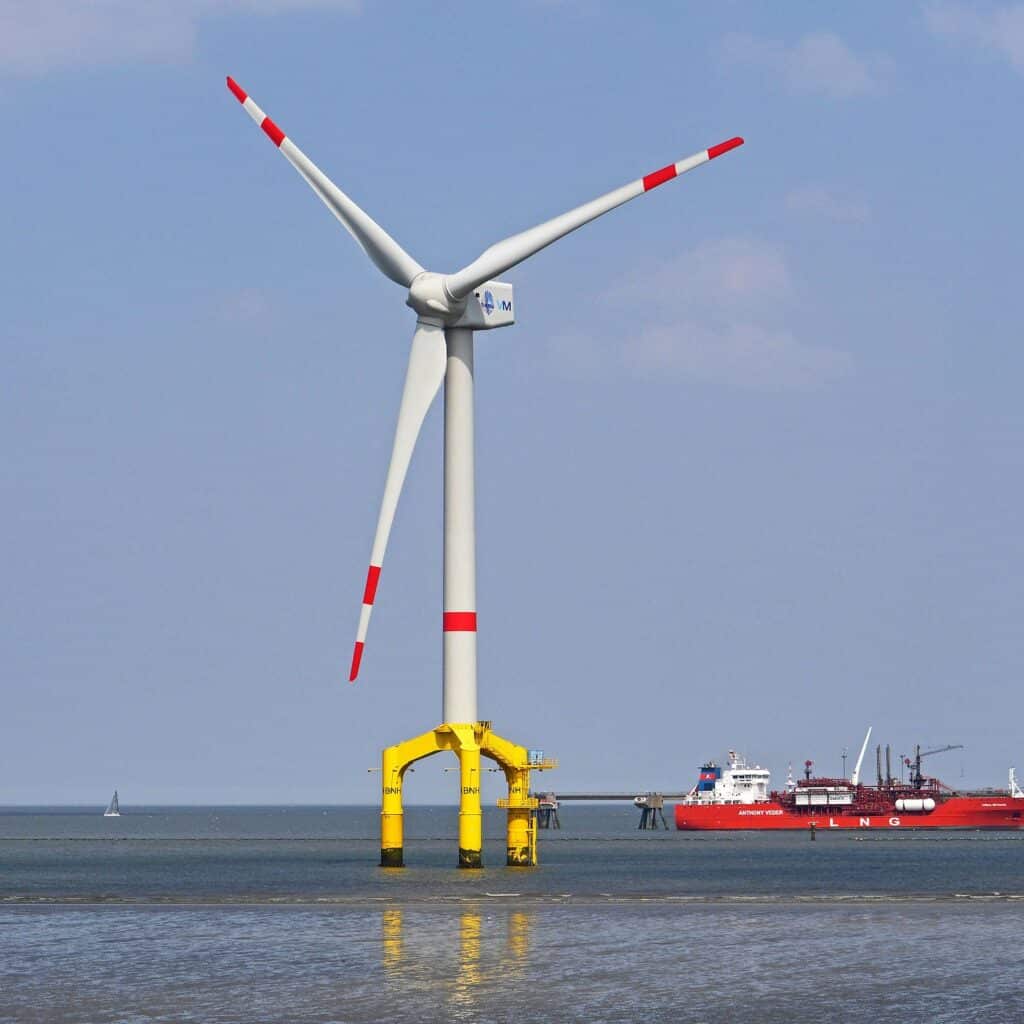
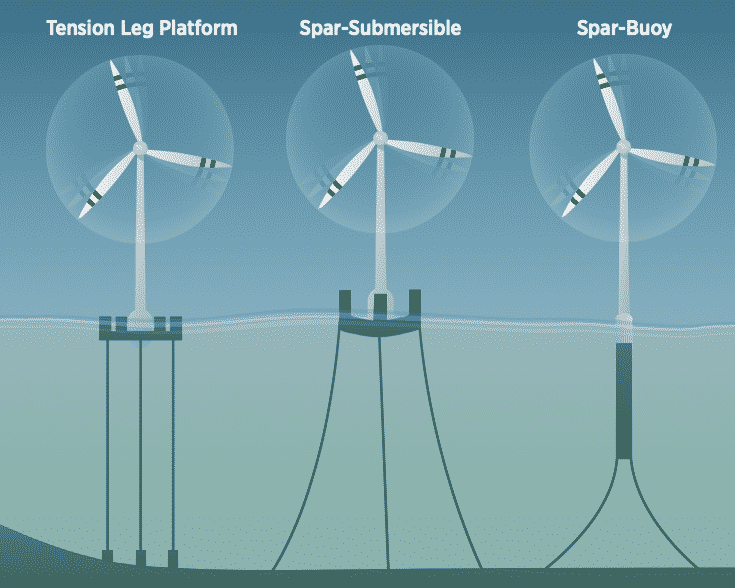
Global cumulative installed capacity of offshore wind increased by over ninefold between 2010 and 2019, from 3.1 GW to 28.3 GW. This was largely driven by installations in Europe, which accounted for 78% of cumulative global deployment by the end of 2019.
More infos about Offshore Wind in chapter 4 of the report

Key findings
Newly installed renewable power capacity increasingly costs less than the cheapest power generation options based on fossil fuels. The cost data presented in this comprehensive study from the International Renewable Energy Agency (IRENA) confirms how decisively the tables have turned.
The key findings are available in Arabic (عربي), Chinese (中文), French (français), German (Deutsch), Japanese (日本語), Spanish (español).
More than half of the renewable capacity added in 2019 achieved lower electricity costs than new coal. New solar and wind projects are undercutting the cheapest of existing coal-fired plants, the report finds. Auction results show these favourable cost trends for renewables accelerating.
See the interactive infographic on How Falling Costs Make Renewables a Cost-effective Investment
Solar and wind power costs have continued to fall, complementing the more mature bioenergy, geothermal and hydropower technologies. Solar photovoltaics (PV) shows the sharpest cost decline over 2010-2019 at 82%, followed by concentrating solar power (CSP) at 47%, onshore wind at 40% and offshore wind at 29%.
Electricity costs from utility-scale solar PV fell 13% year-on-year, reaching nearly seven cents (USD 0.068) per kilowatt-hour (kWh) in 2019. Onshore and offshore wind both fell about 9% year-on-year, reaching USD 0.053/kWh and USD 0.115/kWh, respectively, for newly commissioned projects. Costs for CSP, still the least-developed among solar and wind technologies, fell 1% to USD 0.182/kWh.
Among other implications:
- Replacing the costliest 500 gigawatts of coal capacity with solar and wind would cut annual system costs by up to USD 23 billion per year and yield a stimulus worth USD 940 billion, or around 1% of global GDP.
- Replacing the costliest coal capacity with renewables would also reduce annual carbon dioxide (CO2) emissions by around 1.8 gigatonnes, or 5% of last year’s global total.
- By 2021, up to 1 200 gigawatts of existing coal-fired capacity would cost more to operate than new utility-scale solar PV would cost to install.
- Continuing cost declines confirm the need for renewable power as a low-cost climate and decarbonisation solution, aligning short-term economic needs with medium- and long-term sustainable development goals.
- Renewable power installations could form a key component of economic stimulus packages in the wake of the COVID-19 pandemic.
Along with reviewing overall cost trends and their drivers, the report analyses cost components in detail. The analysis spans around 17 000 renewable power generation projects from around the world, along with data from 10 700 auctions and power purchase agreements for renewables.
This post is republished from the IRENA web site.

